

The average repeat purchase rate for ecommerce sits at about 28.2%, according to a benchmark across Shopify and DTC stores Source. That means roughly one in four of your customers comes back for a second order. The other three buy once and vanish.
I want to give you the real number, not a comforting one. So here is the honest version up front: 28% is the blended figure, and blended is close to useless on its own. A grocery brand and a jewellery brand live in different universes, and comparing yourself to the average tells you almost nothing about whether your store is healthy. The real benchmark is your category, not the blended average, so the numbers below are broken out by vertical, with what a good rate looks like and the one order that decides it.
What is the average repeat purchase rate for DTC brands?
Across all ecommerce, the average repeat purchase rate is around 28%, and most aggregators put the typical DTC brand in a 25% to 30% band over a twelve month window Source. But the largest single dataset I could find, 156,110 DTC customers analysed in 2026, came out lower at 18.8% Source. Both are true. They just measure slightly different things.
Look at that spread. Grocery sits at 65.2% and luxury at 9.9% Source. That is more than a 6x gap between the top and the bottom of the same metric. This is why the headline average is a trap. A supplements founder celebrating 30% is quietly underperforming, and an apparel founder panicking at 24% might be doing fine.
Why is the 28% average almost useless on its own?
Because repeat purchase rate is a function of how often your product runs out, not how good your brand is. A coffee bag is empty in three weeks. A sofa lasts a decade. No amount of marketing changes that underlying cadence, so the only fair comparison is against brands that sell the same kind of thing you do.
The measurement window matters just as much. A 90 day repeat rate and an annual one describe the same store with very different numbers. When you read a benchmark, check three things: the window it uses, whether it counts any second order or a specific timeframe, and whether it is one store or thousands. Most of the confusion in this space comes from comparing figures that were never measuring the same thing.
Repeat purchase rate measures how often your product runs out, not how good your brand is. Compare against your category or do not compare at all.
What is the repeat purchase rate by category in 2026?
Consumables lead by a wide margin. Food and beverage and other replenishable goods run 35% to 45%, beauty and skincare land at 30% to 40% on an annual basis, apparel sits at 20% to 26%, and jewellery trails at 9% to 11% Source. The pattern is simple: the faster a product is used up, the higher the rate.
Here is the fuller map to place yourself against. Subscription boxes run highest at 40% to 55%, followed by consumables at 35% to 45%, health and wellness at 30% to 38%, home goods at 18% to 25%, and electronics and gadgets at 12% to 18% Source. Supplements specifically sit around 29% to 36%, pet care at 28% to 35%, and coffee and tea at 21% to 30% Source. Within a category the range is still wide, because a serum on a replenishment cycle behaves nothing like an impulse lipstick, even though both are beauty.
Find your row. That range is your real benchmark. If you are at the top of your category band, you have a retention engine. If you are at the bottom, you are almost certainly buying the same customer twice through paid acquisition and calling it growth.
What counts as a good repeat purchase rate?
A good repeat purchase rate is one at or above the top of your category range, and a warning sign is anything that leaves you dependent on new acquisition to stand still. As a rough read across DTC, the median lands near 27%, and the brands with a genuine retention flywheel push past 40% in categories that allow it Source.
The reason a good rate matters so much is compounding. Repeat customers drive the majority of ecommerce revenue over time, with roughly 65% of a company's revenue coming from existing customers rather than new ones Source. Every point you add to your repeat rate stacks on a base you have already paid to acquire. That is the cheapest revenue you will ever earn.
Why is the second order the hinge everything turns on?
The second order is the hinge because a customer's likelihood of buying again jumps sharply once they cross it. Customers who make a second purchase are 45% more likely to make a third, and those who make a third are 54% more likely to make a fourth Source. The first repeat is the hardest and the most valuable to earn. After that, momentum starts working for you.
The window to earn it is narrower than most brands think. Of customers who do come back, 50.3% place their second order within one month and 76.4% within three months Source. So the entire game is played in the weeks right after the first delivery. Miss that window and the odds of ever seeing that customer again fall off a cliff.
The problem is that this is exactly where most brands go quiet, or worse, blast the same generic flow to everyone who bought last week. The person who bought a 30 day supply and the person who bought a gift need completely different messages at completely different moments. Getting that right by hand, for every customer, has never been possible with a small team. That is the real ceiling.
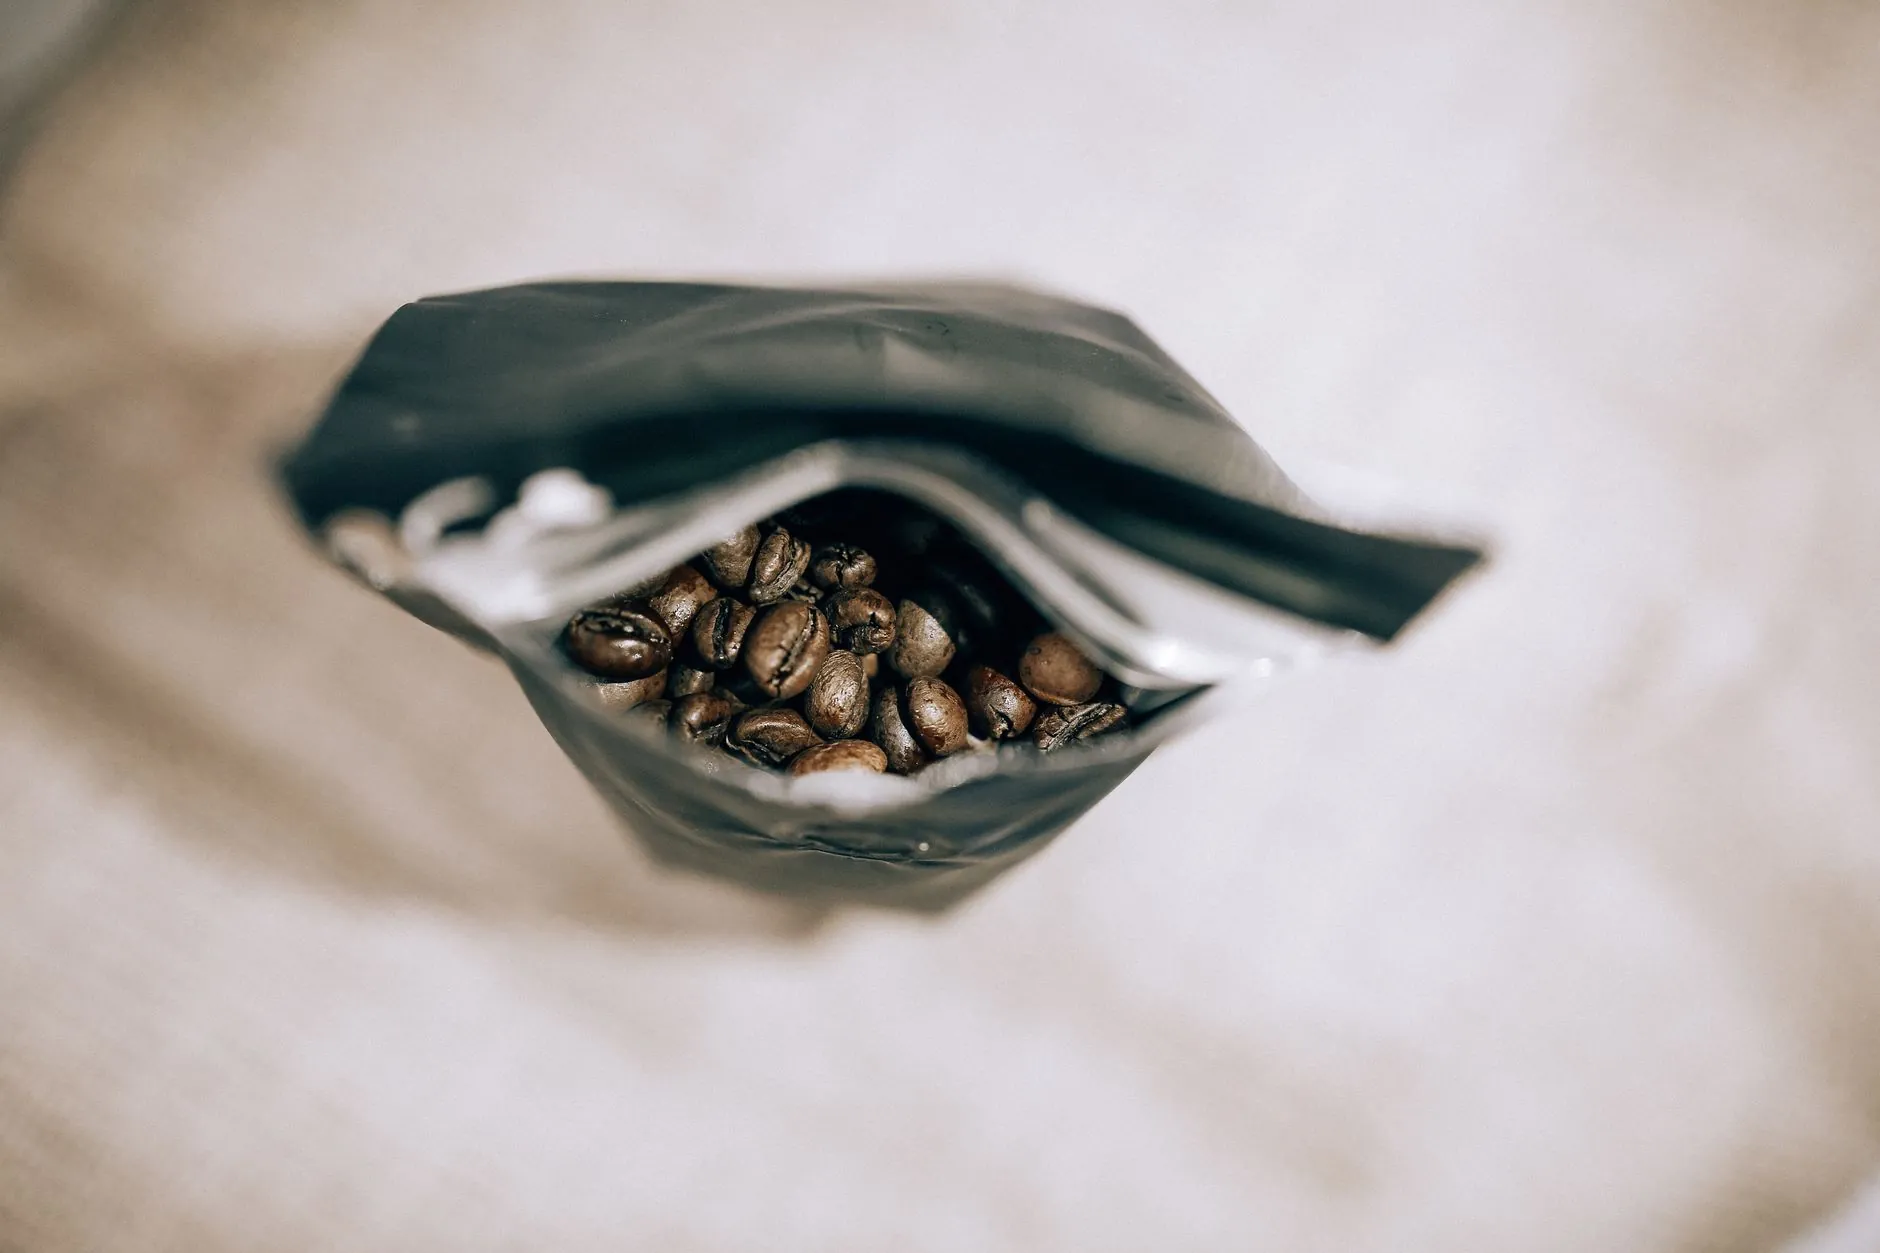
About a week from the bottom of the bag
Want your next one to land before the last cup? One tap reorders the exact roast you had.
Reorder the same roastHow do you actually move your repeat purchase rate?
You move it by treating the first order as the start of a relationship and acting on the second-order window for each customer individually, rather than sending one flow to a whole segment. The lever is timing and relevance, matched to how a specific person actually buys. A reminder that lands the week their product runs low will always beat a calendar blast that ignores when they bought.
Doing that one customer at a time is the part no small team has the hours for. This is where an agentic approach changes the maths. PilotX runs four agents on every customer, so the work that used to need a headcount you do not have simply gets done, on your brand's own voice and real products.
You stay in charge. You set the goal in plain English, lift the second-order rate for first-time buyers, and you approve what goes out. The AI does not replace the marketer. It removes the hours cap so a small team can finally work every customer the way you would if you had a hundred of you. Category economics model this at up to 50% more revenue, measured against the control group you choose, not a promise but a floor to hold the work to. PilotX is paid 10% of the extra sales over that group, nothing if there is no extra, capped at $2,500 a month.
What is the one number to take away?
Compare yourself to your category, not the 28% average, and then obsess over the second order. That is the single point of leverage that turns a store you keep refilling with paid traffic into one that compounds. The consumable brands hitting 40%-plus are not smarter marketers. They just have a product cycle that forces the second order, and a system that shows up at the right moment to earn it Source.
If you want to know where your own leaks are, we built a free tool that finds them. It maps where you are losing repeat revenue and what it is worth to fix. Run the free Revenue Leak Audit, see your gap against your category, and if you want the fuller picture of how the pilot works, the offer lays it out. Or read how it maps to a store like yours on Shopify.